
#Wildfire Analysis
#Preset Dynamics
The active-fire lifecycle is deterministic: Blaze → Fire → Ember → Char.
All active-fire states count equally as burning neighbors. Vegetation resistance determines both whether ignition occurs and its initial intensity:
| Vegetation | Ember at |
Fire at |
Blaze at |
|---|---|---|---|
Grass |
burning neighbor | ||
Bush |
burning neighbors | ||
Tree |
burning neighbors |

Grass, Bush, Tree, and Char otherwise remain unchanged.
#Derived Metrics
Initial fuel is the first recorded Grass + Bush + Tree population. Total burn fraction is:
Vegetation-specific burn fractions use the same formula separately for Grass, Bush, and Tree. Active fire is simply Ember + Fire + Blaze.
- Fire duration: final active-fire generation minus first recorded generation.
- Peak active fire: largest active-fire count divided by initial fuel.
- Time to peak: peak generation minus first recorded generation.
- Maximum burn rate: largest positive -generation loss of
Grass,Bush, andTree, divided by initial fuel. - Cumulative burn fraction: fuel lost up to each generation, divided by initial fuel.
#Outcome Distribution
At low and intermediate densities, the seeded fire usually remains local. Median burn fraction is at density and at . At , the median is ; even a fully occupied grid does not imply total consumption because resistant Tree clusters can remain after the fire front disappears.
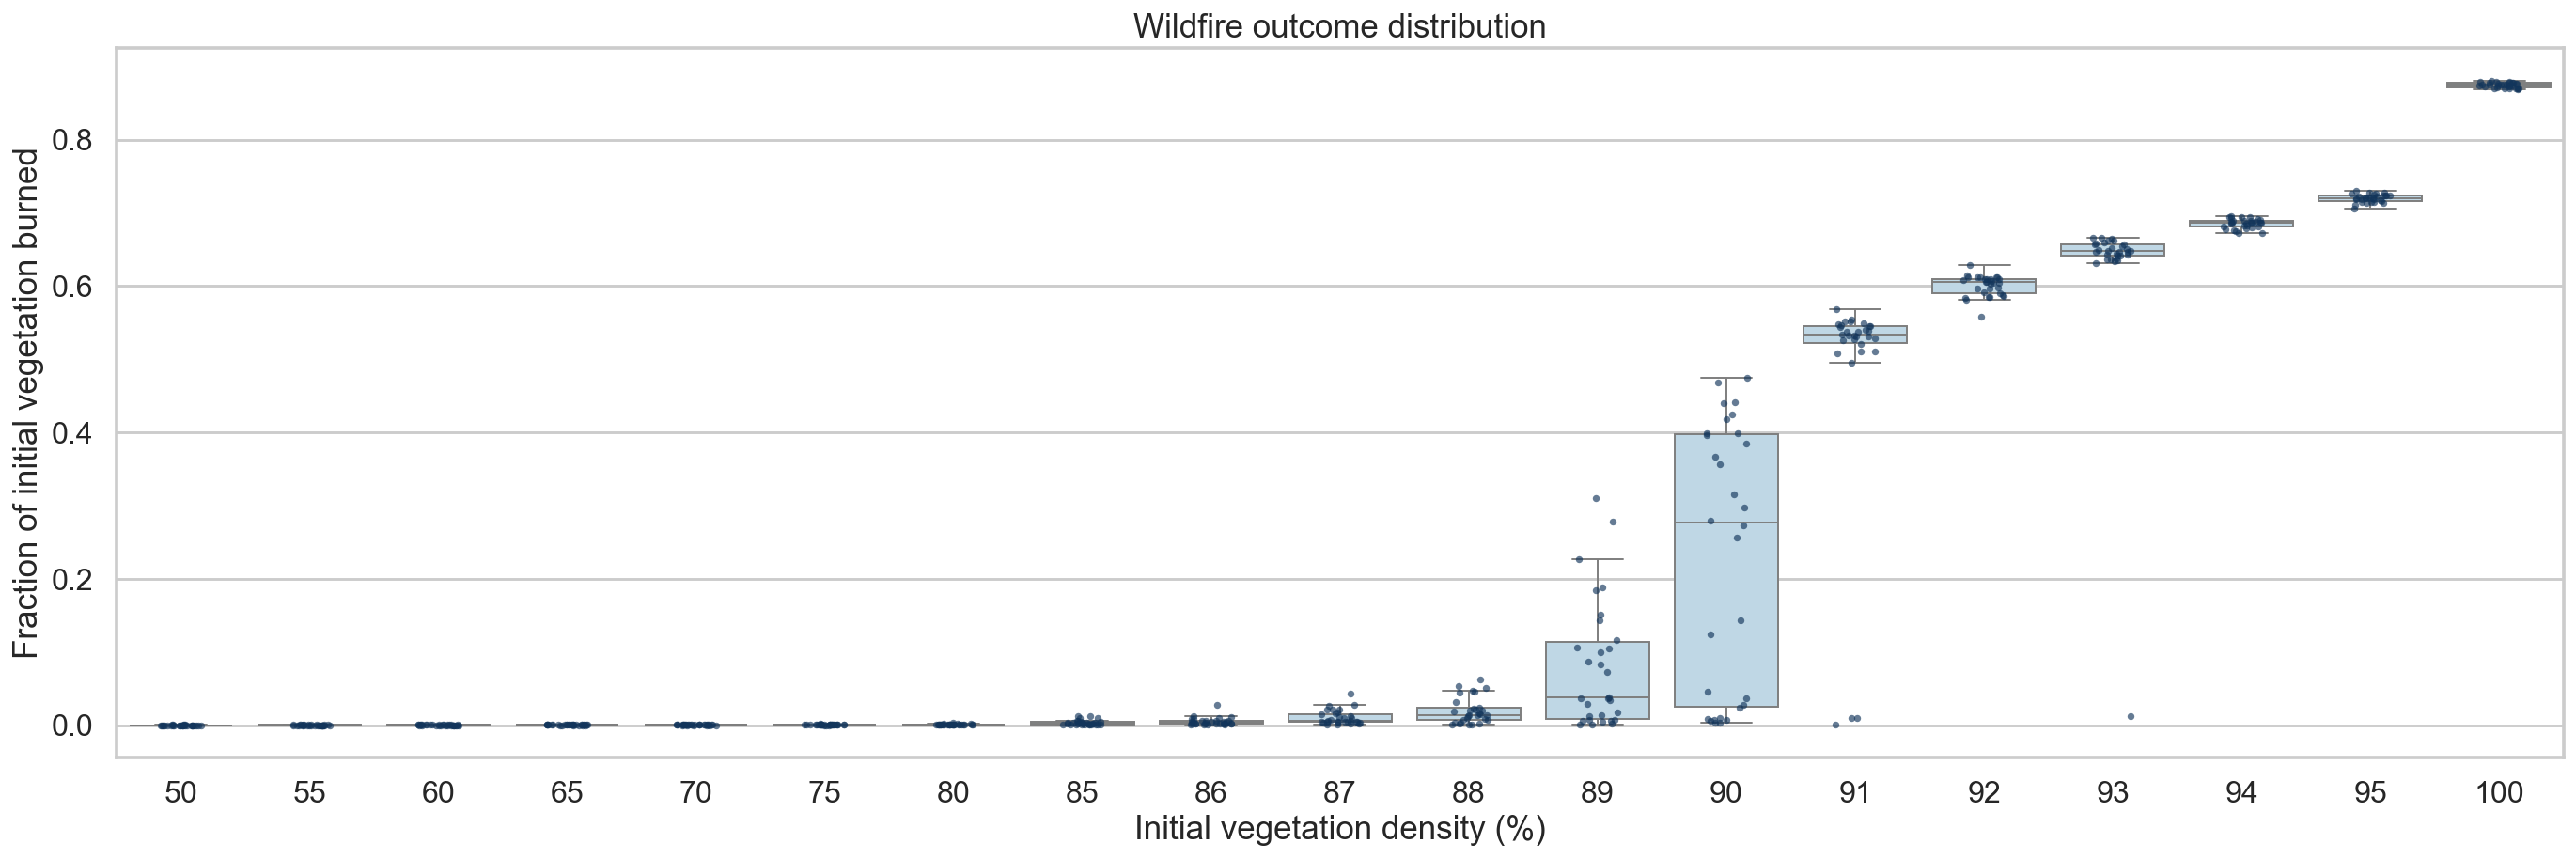
The detailed sweep shows a sharp crossover around :
| Density | Median burned | IQR | ||
|---|---|---|---|---|
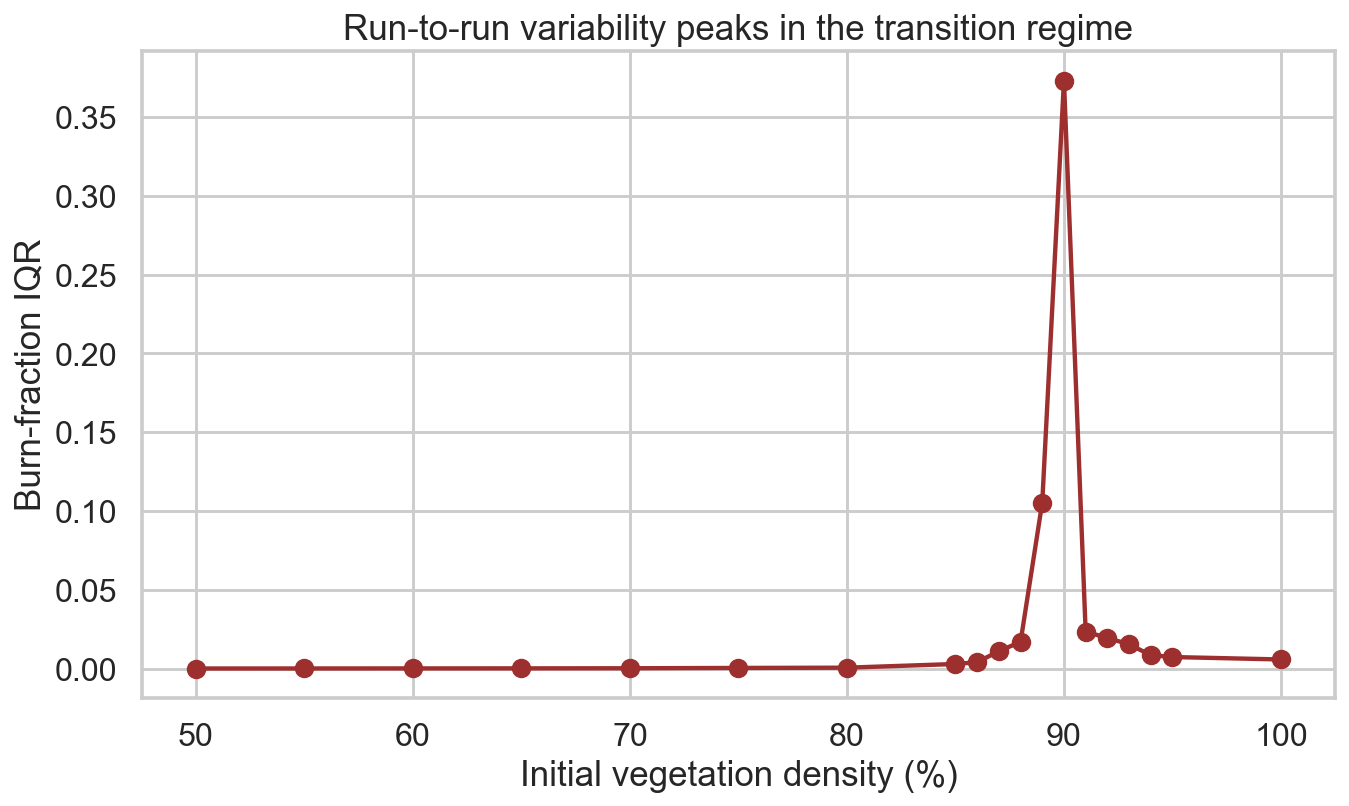
The IQR peaks at , where identical density settings produce both rapid fadeouts and large burns. It then collapses at as large connected burns become the dominant outcome.
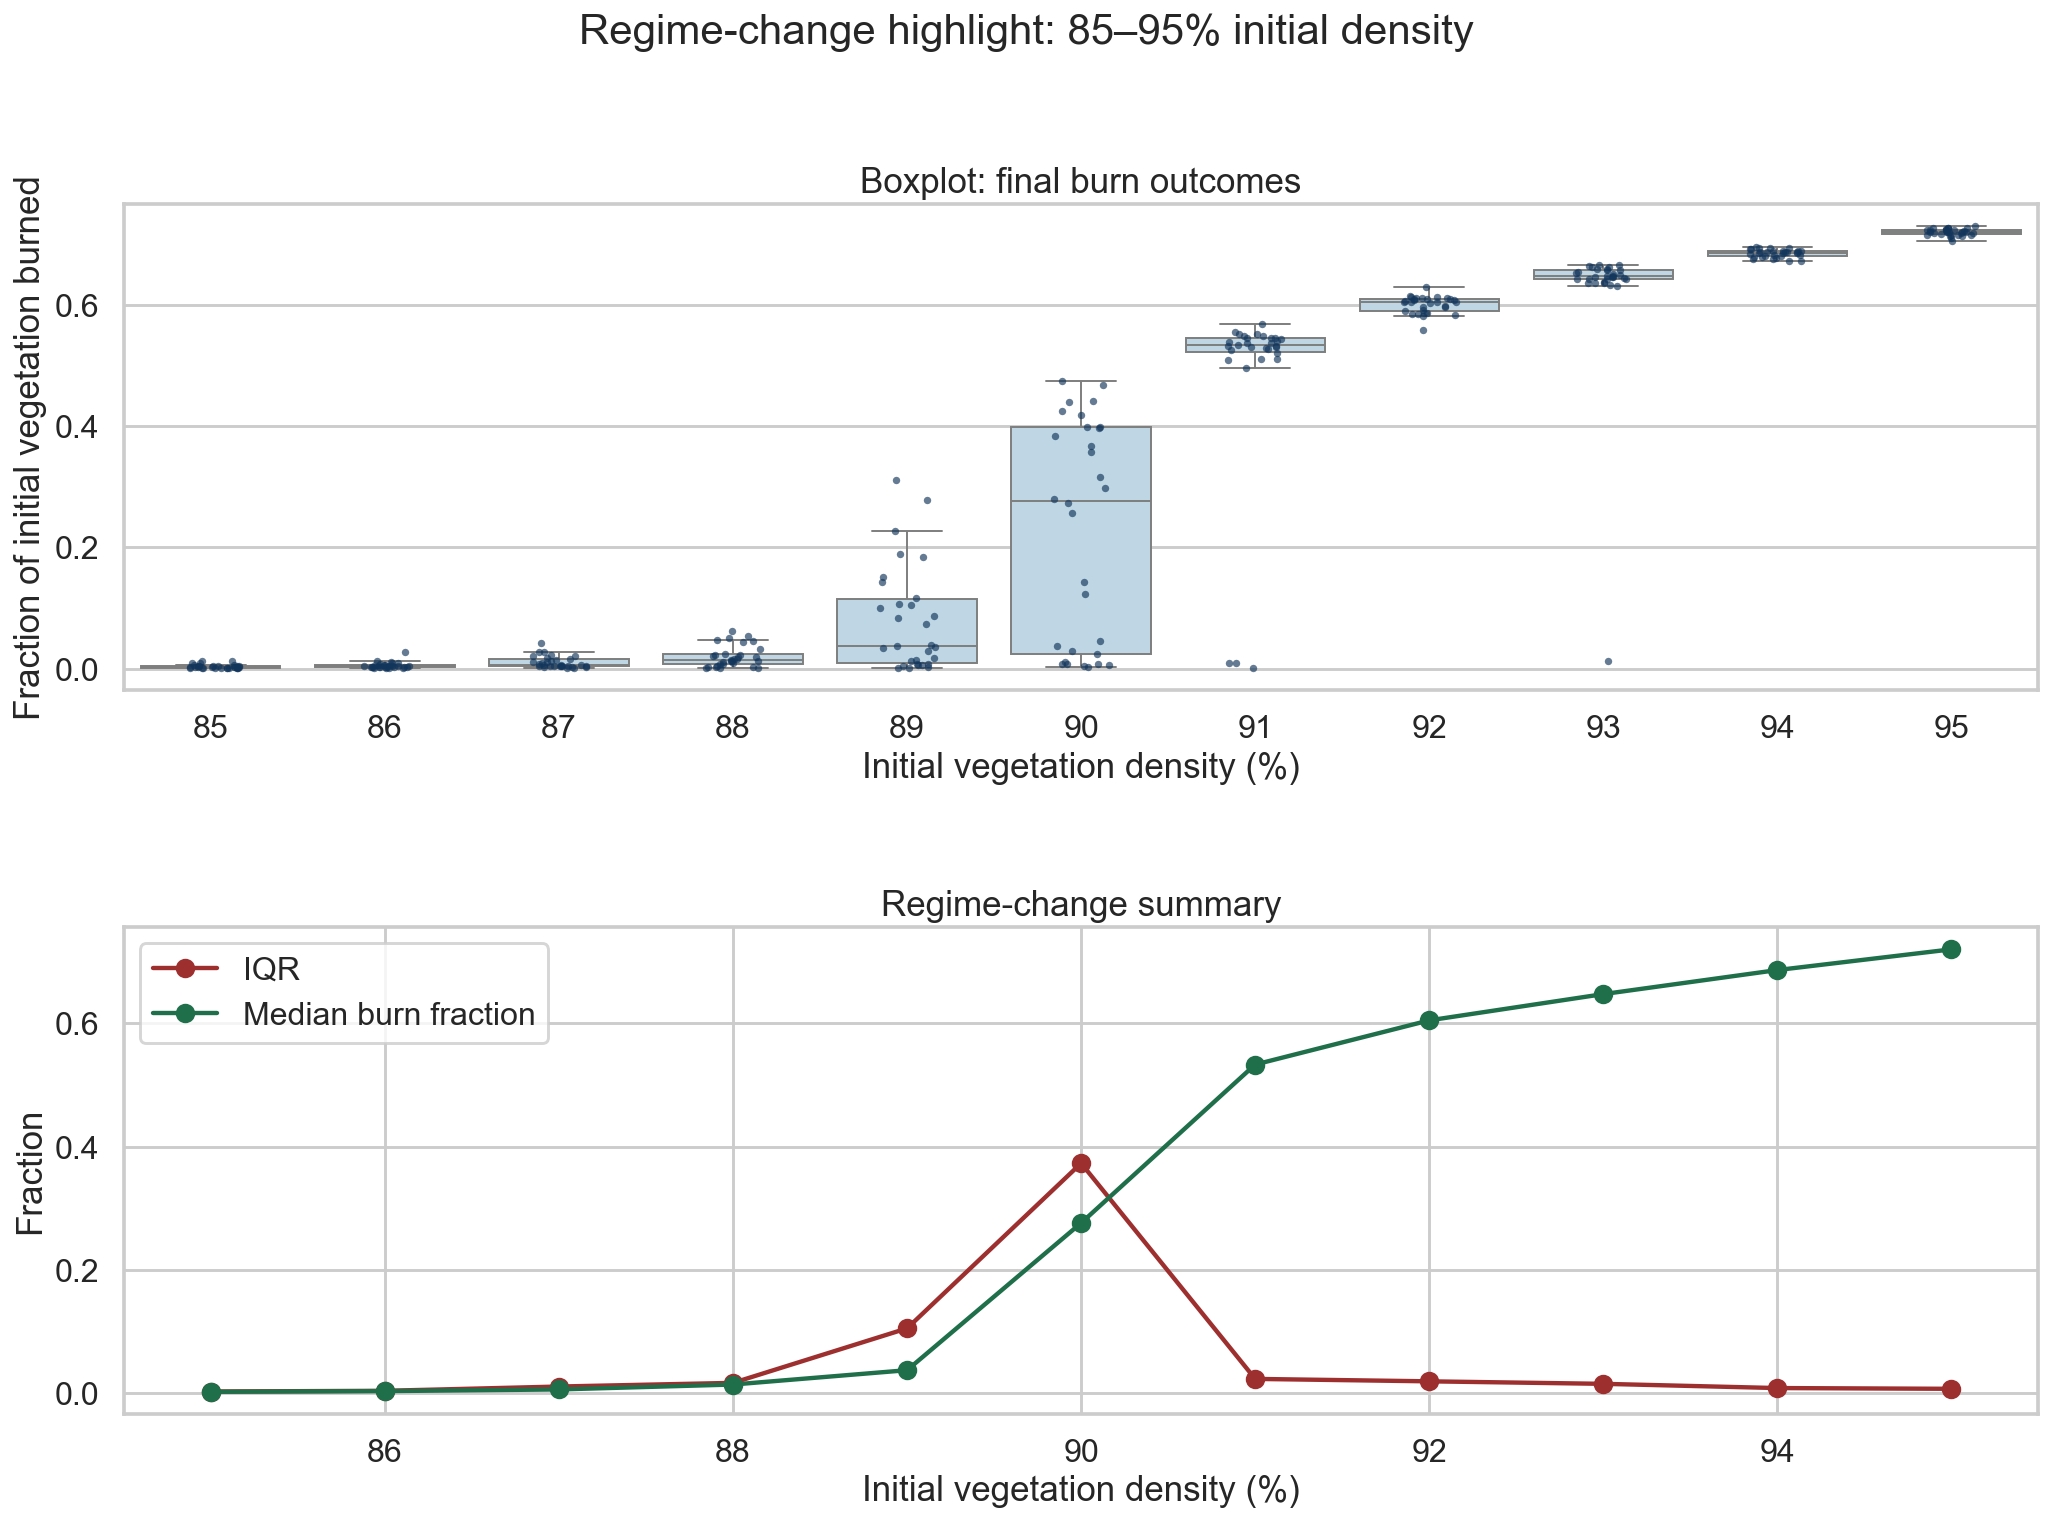
Rare fadeouts still persist above the central crossover. At , of runs burn less than , while burn more than . At , run burns and the other exceed .
#Vegetation Type
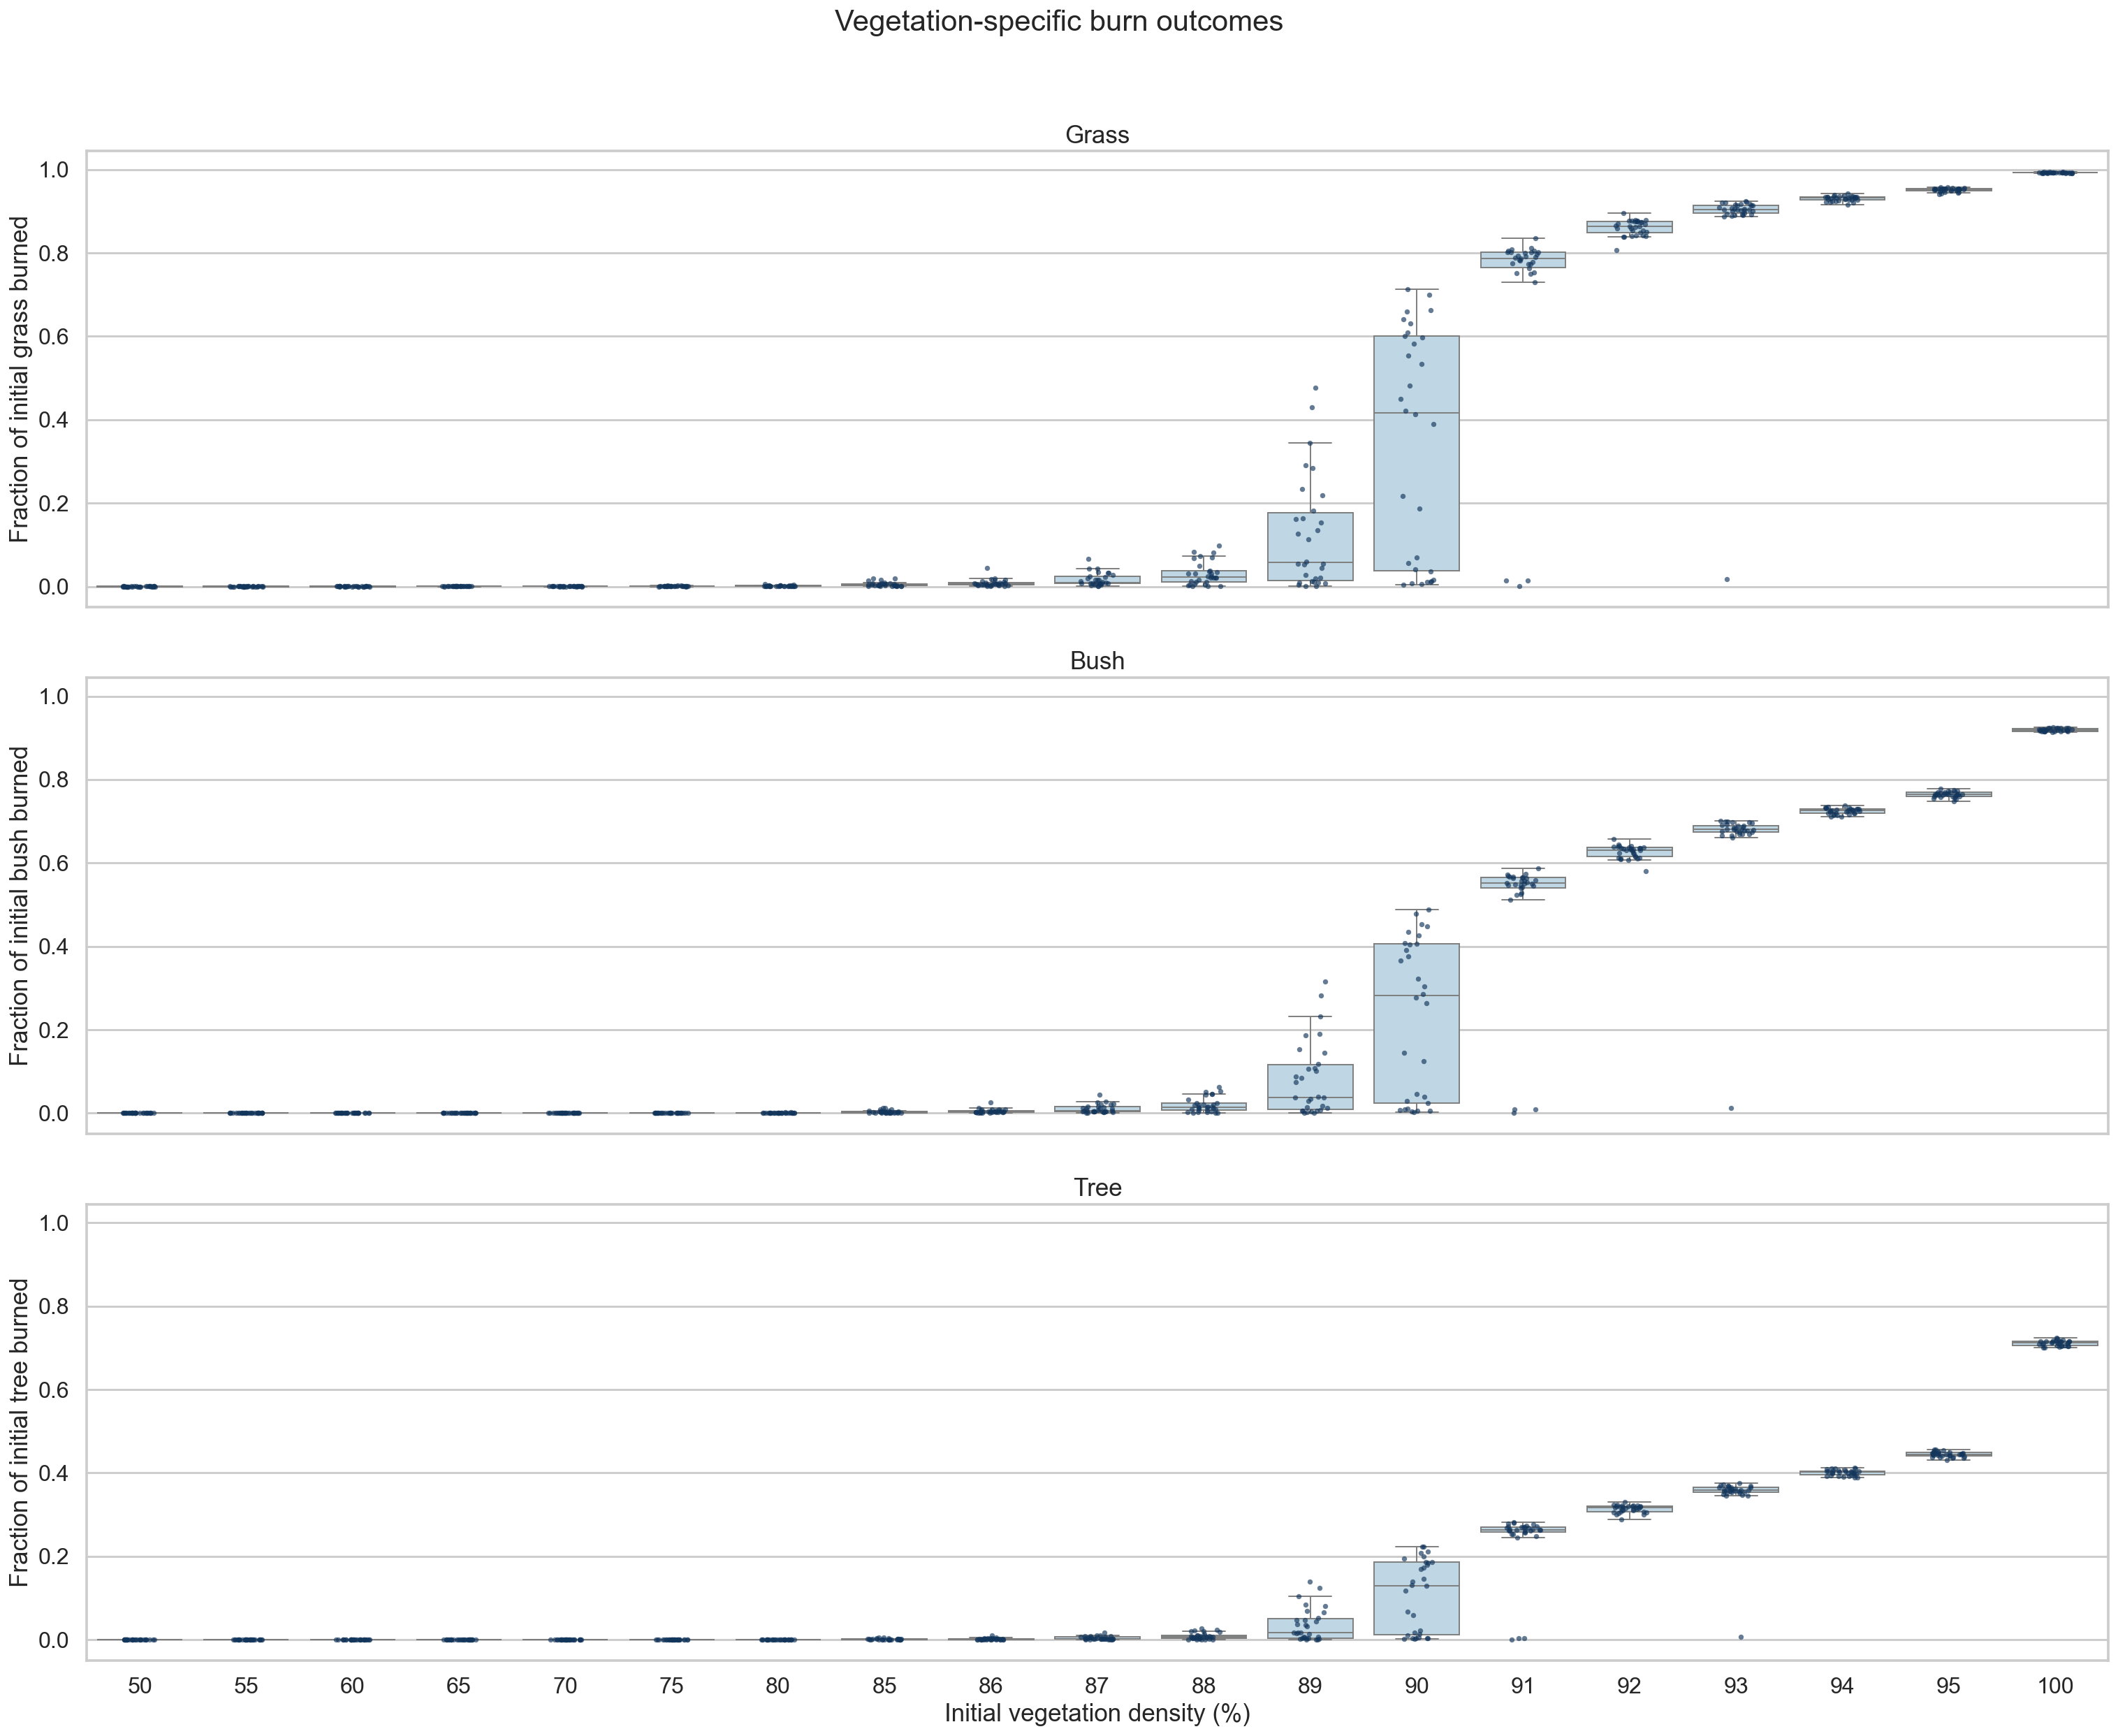
Median loss follows Grass > Bush > Tree at every sampled density, matching the preset's ordered ignition thresholds.
| Density | Grass burned |
Bush burned |
Tree burned |
|---|---|---|---|
These are fractions of each vegetation type's own initial population, not shares of all burned cells.
#Fire Dynamics
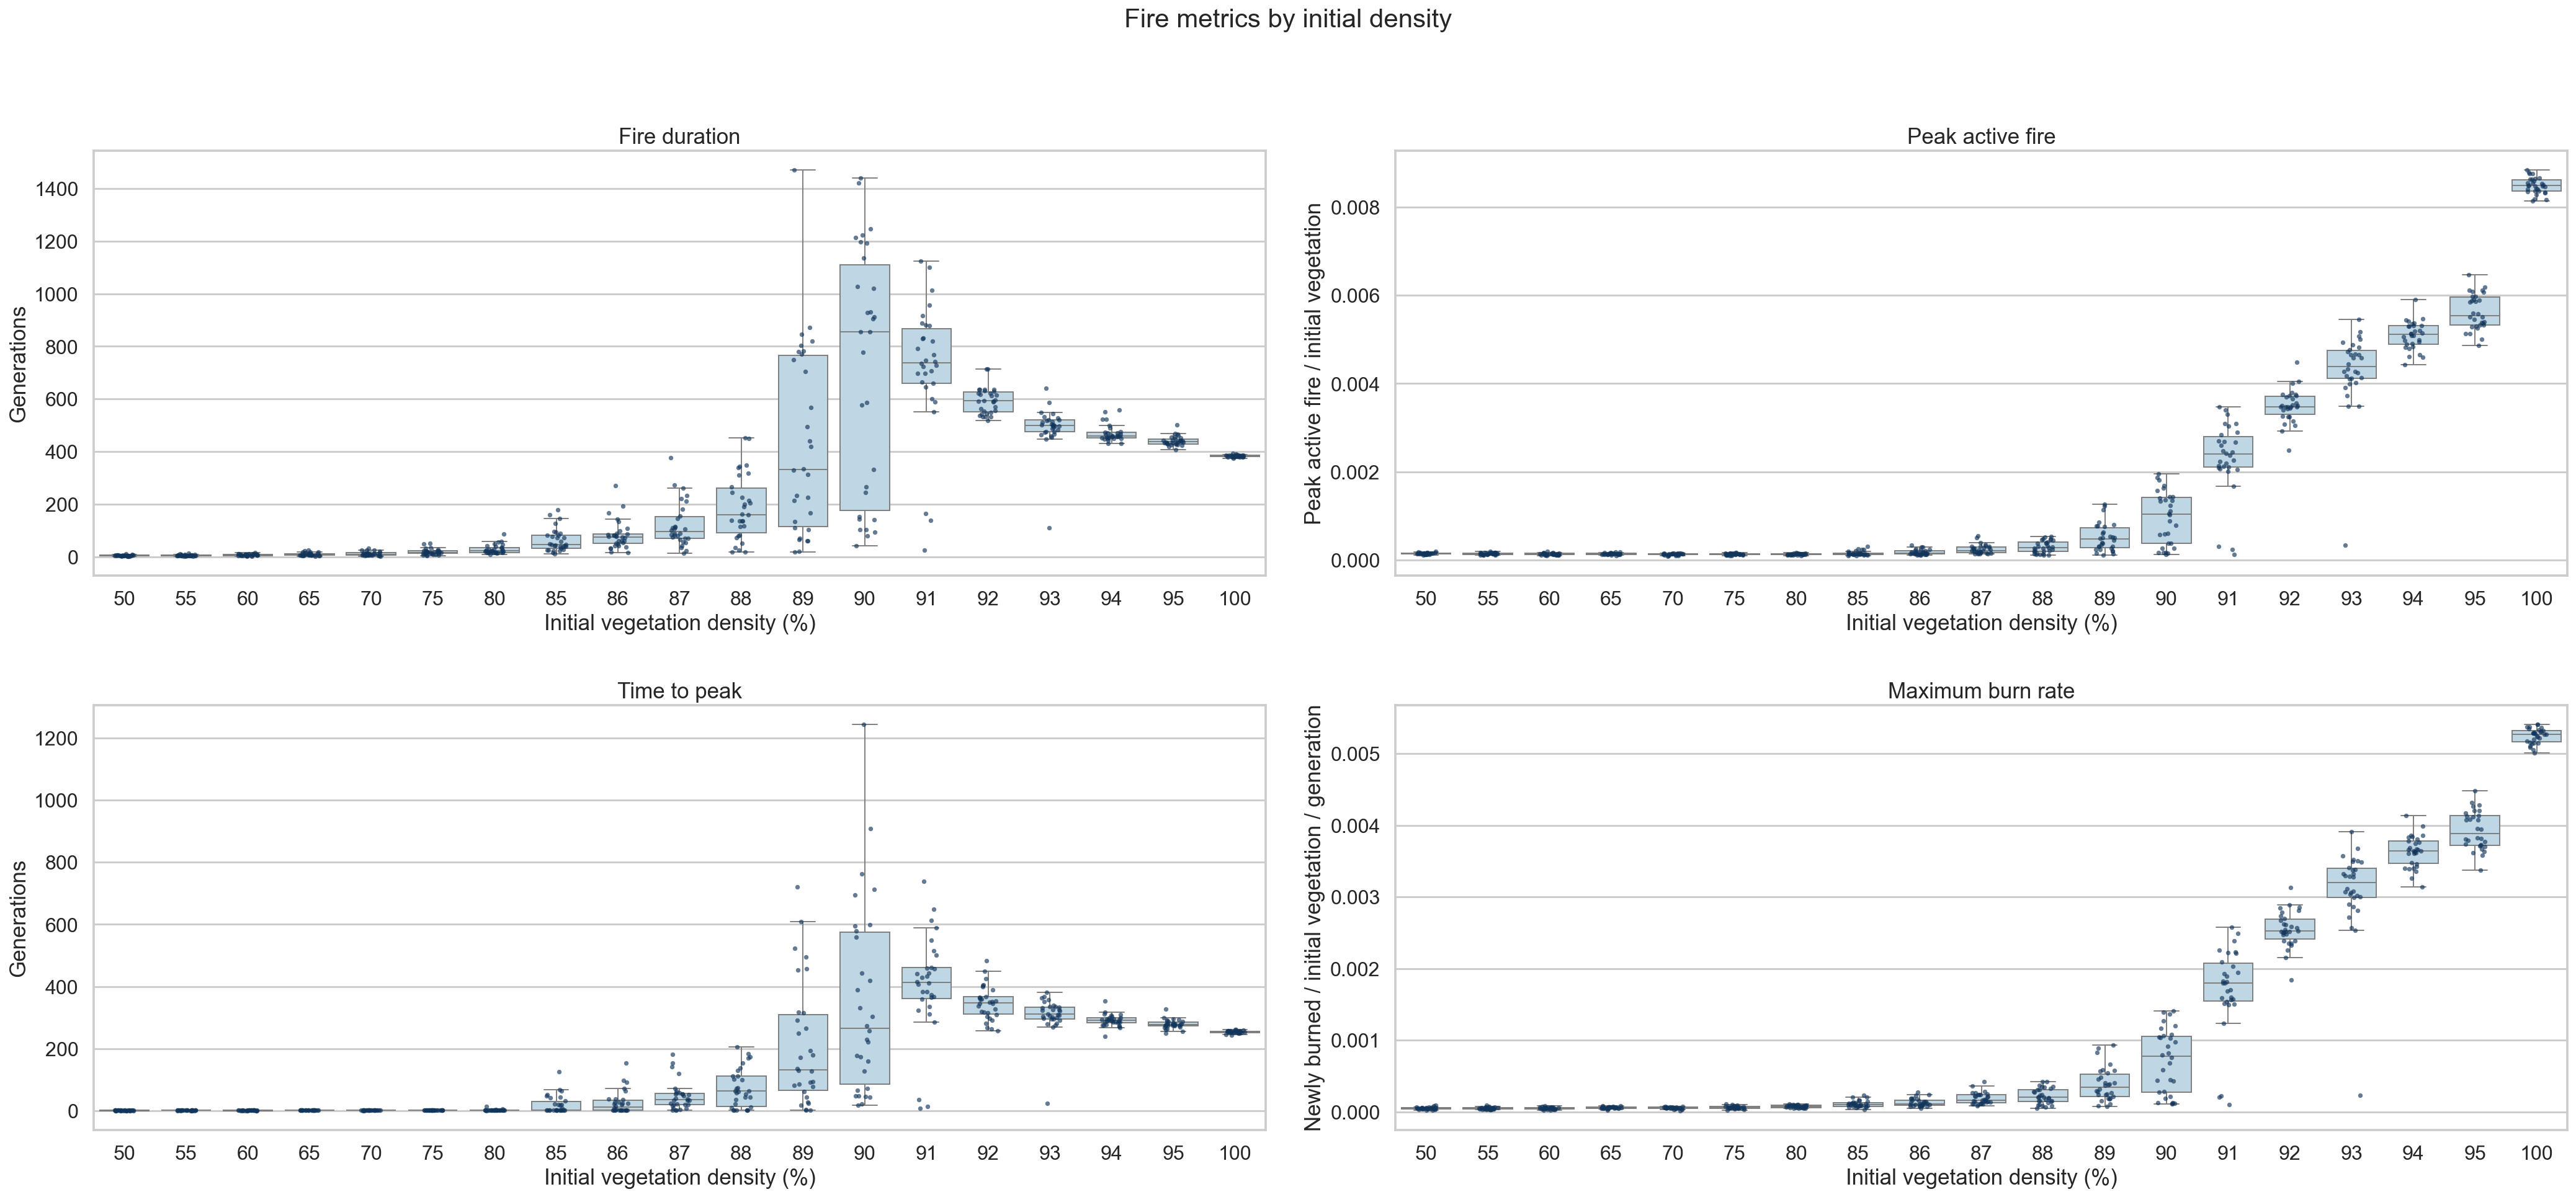
Duration is longest and most variable around the crossover. Median duration rises from generations at to at , then falls to at , at , and at . The longest individual run lasts generations at .
At the same time, intensity rises with density. Median peak active-fire fraction is at , at , at , and at . Median maximum burn rate rises from of initial fuel per generation at to at .
Together, these results distinguish effects: near the crossover, uncertain connectivity produces long, variable exploration of the fuel network; above it, broader fronts consume fuel more intensely and finish sooner.
#Trajectories And Representative Runs
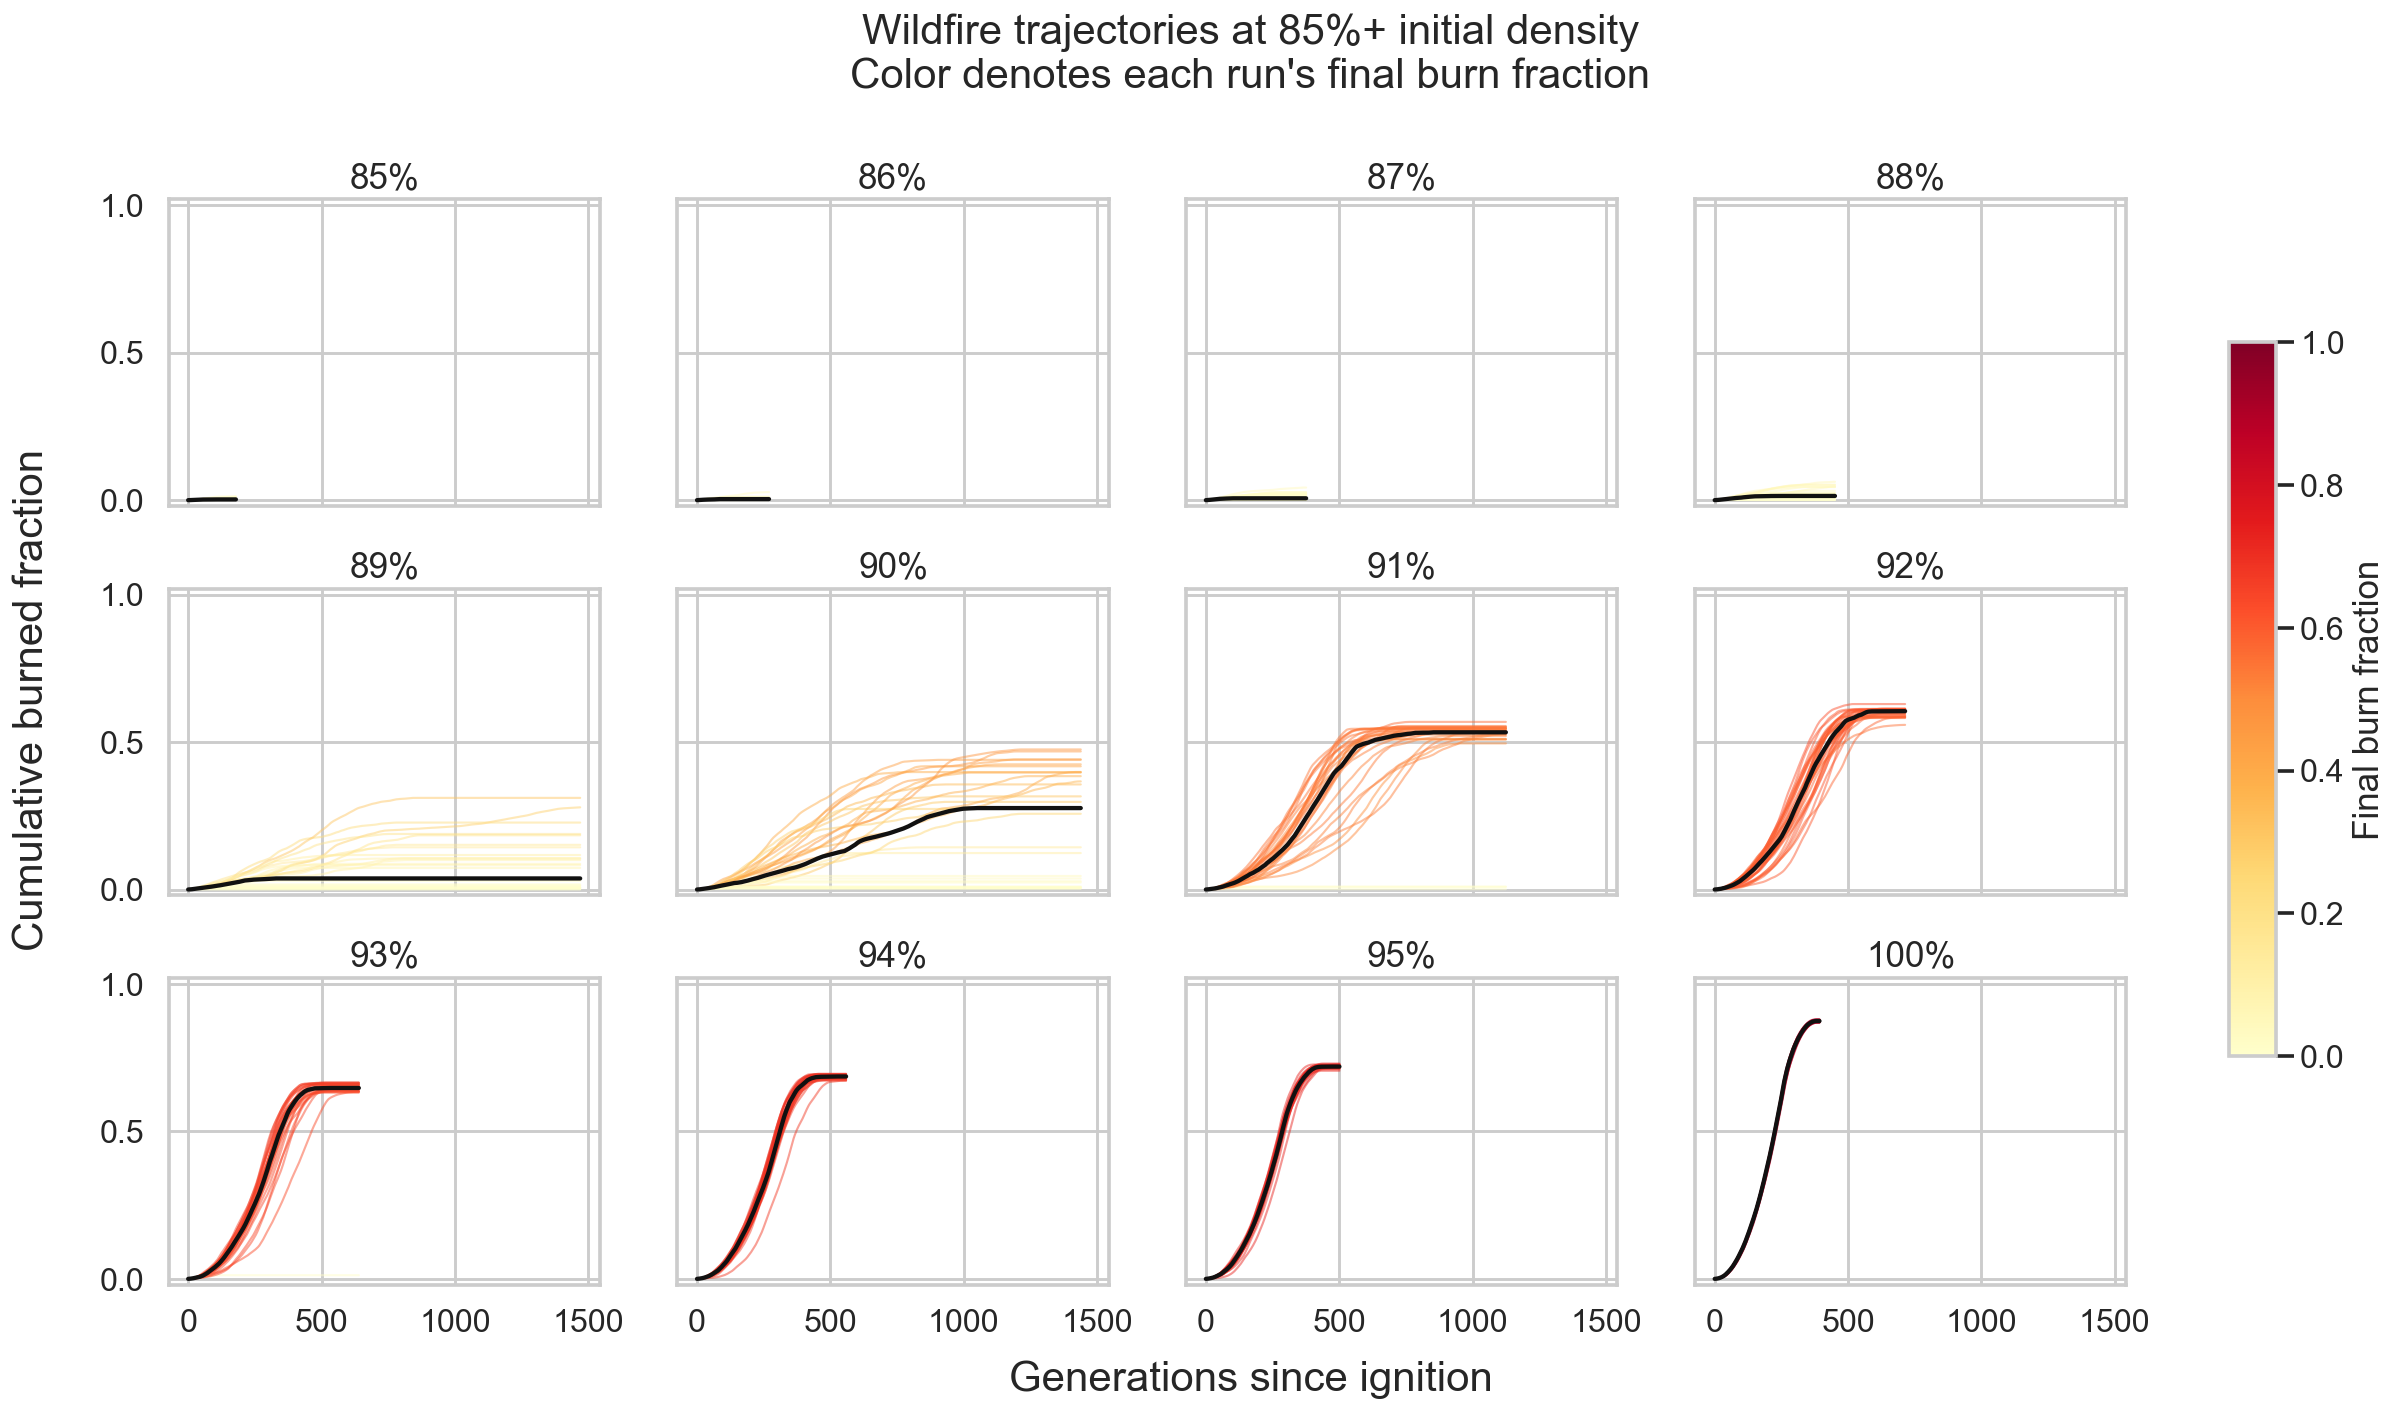
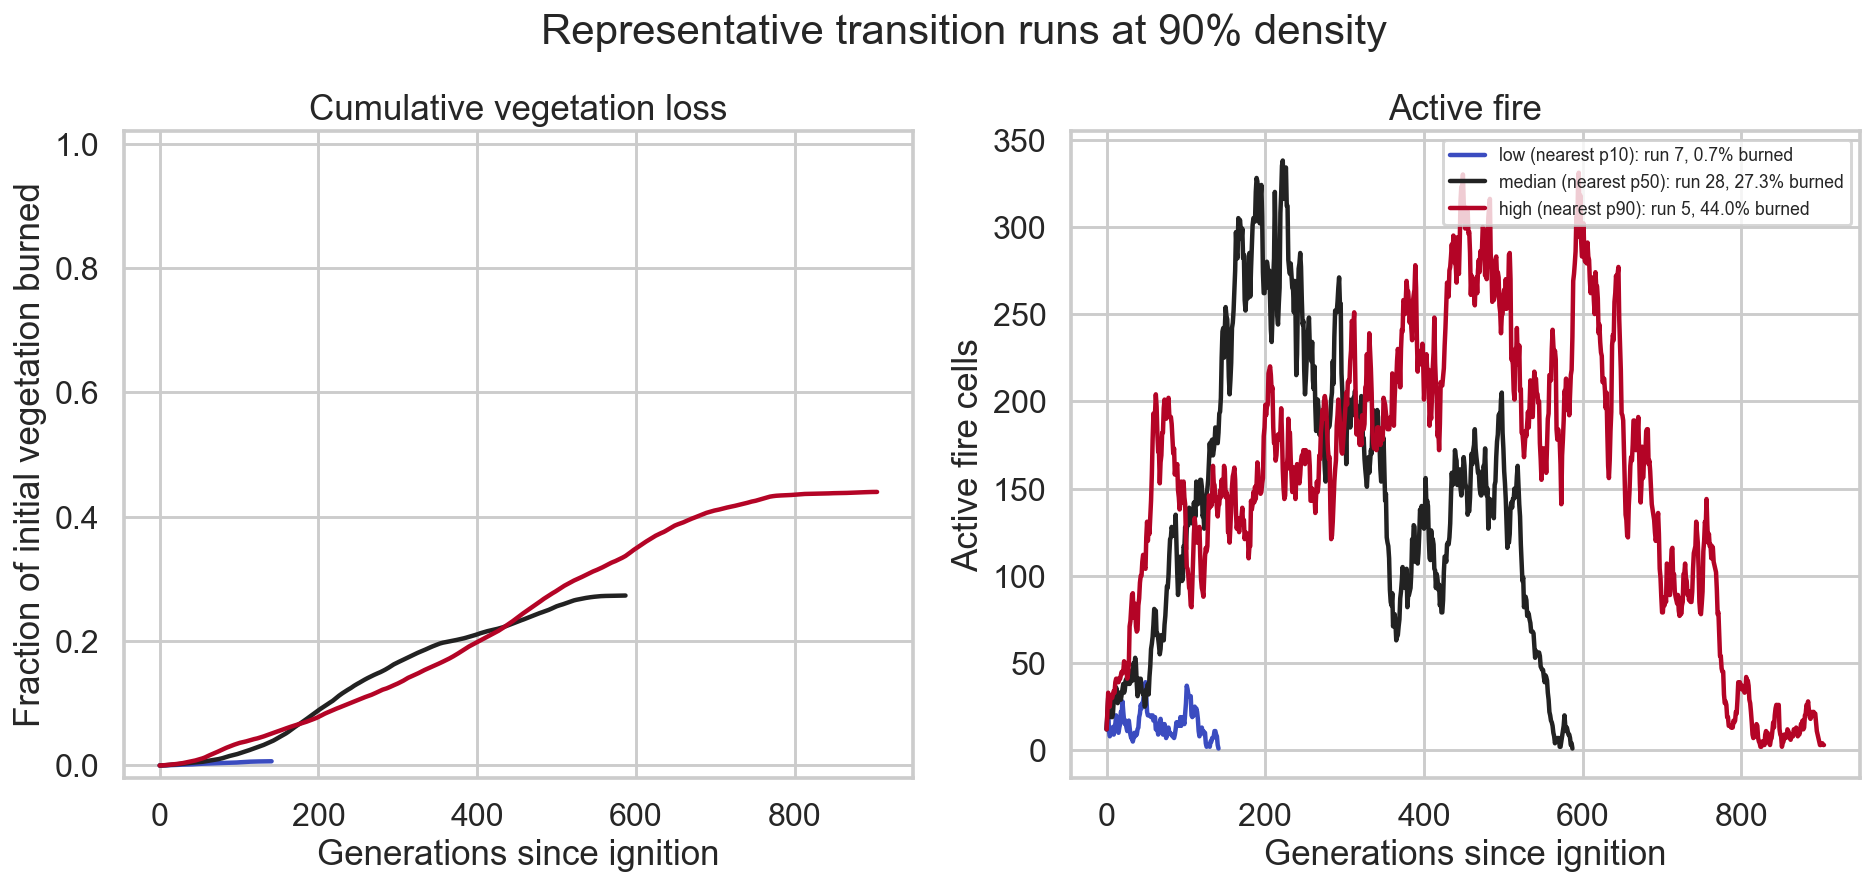
Individual cumulative-burn trajectories separate into distinct fadeout and sustained-spread outcomes near . The transition figure selects runs nearest the , , and burn-fraction percentiles:
| Representative role | Run | Burned | Duration |
|---|---|---|---|
| Nearest | |||
| Nearest | |||
| Nearest |
#Transition Runs In Motion
The recordings below use the same density and correspond to the representative runs in the table and figure above. Together they show how randomized initial vegetation layouts produce rapid fadeout, intermediate spread, or a large burn even though the subsequent Wildfire evolution is deterministic.
| Low outcome – Run | Median outcome – Run | High outcome – Run |
|---|---|---|
| burned generations |
burned generations |
burned generations |
#Typical Runs Across Regimes
The run is intentionally brief: its -generation fadeout is representative of a regime in which fire cannot find a connected path through the fuel. The run shows the contrasting broad fire front and the survival of some resistant vegetation.
| Typical – Run | Typical – Run |
|---|---|
| burned generations |
burned generations |
#Long-Lived Near-Transition Fire
The longest Wildfire run in the dataset occurs at density. Run burns of its initial fuel over generations, illustrating the slow exploration of marginally connected fuel paths near the crossover.